Uptime Kuma
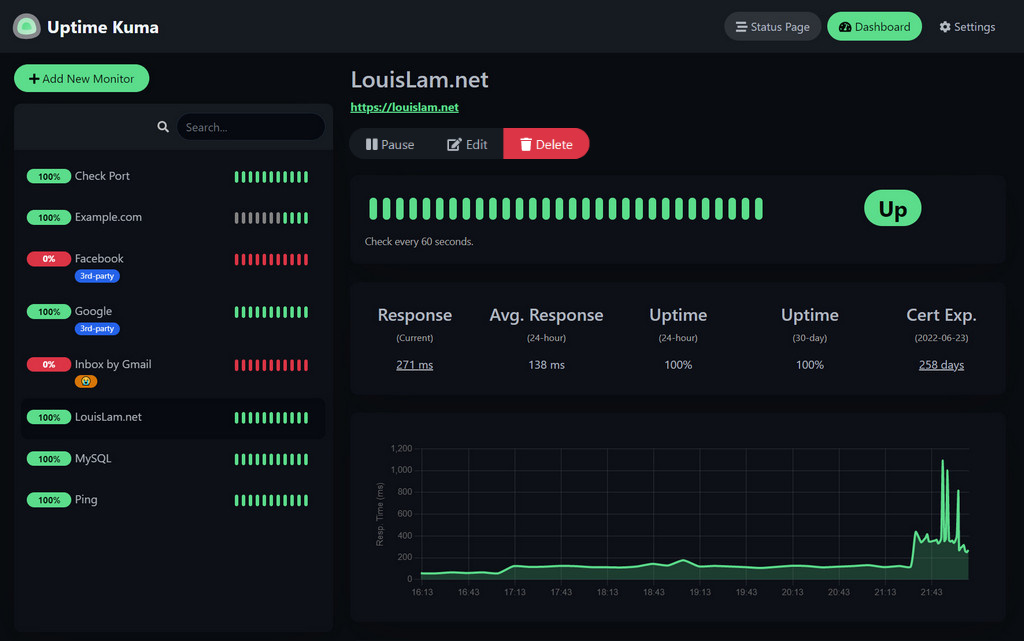
Self-hosted uptime monitor with a web dashboard, status pages and 90+ alert services

Our verdict
#1 of 4 in Self-hosted uptime monitors · Best for most self-hosters
Pros
- The widest choice of alert services of the four
- One container with SQLite, set up from the browser
- Two-factor login
Cons
- The docs describe no supported API and no way to export monitors
- No documented support for separate user accounts or roles
Who should skip:Teams that need separate logins with different permissions.
Rankings and alternatives


Self-hosted uptime monitors scores
Evaluated Nov 7, 2026 Evidence ↓- Components to run 4
4/5 means: One container with storage built in; installing without a container needs a separately installed language runtime or build tool
One Docker container keeps its data in a mounted folder, with SQLite as a database option; installing without Docker needs Node.js 20.4 or newer.
- What it can check 3
3/5 means: Seven of the nine
The feature list covers HTTP(S) keyword checks, TCP, ping, DNS records, push, and Docker containers, and certificate info is listed, which makes seven of the nine. Database queries and server CPU, memory and disk use are not in the documentation we found.
Rests partly on what the sources don't mention, which is a weaker signal than what they say.
- Fastest check interval 4
4/5 means: 16 to 59 seconds
The feature list gives 20-second intervals.
- Alert channels 5
5/5 means: 50 or more
The README lists 90+ notification services.
- Public status pages 4
4/5 means: Four of the five
Multiple status pages, a domain per status page, a pinned incident on a status page, and maintenance messages on status pages are documented; a way for visitors to subscribe is not.
- Ways to manage monitors 1
1/5 means: One of the five
Monitors are managed in the web interface. The API it uses is described as internal and not officially supported for third-party integrations, and version 2 removed JSON backup and restore, leaving a copy of the data directory as the only backup method. No configuration file for monitors is documented.
- Sign-in and users 3
3/5 means: Two of the four
A login and two-factor login are documented. Single sign-on isn't documented, and support for several admin users is the subject of a pull request rather than a documented feature.
- Getting data out 4
4/5 means: Three of the four
A Prometheus endpoint with metrics for each monitor, SVG badges for public monitors, and API keys for the metrics endpoint that can't open the web interface. The status page data endpoint belongs to the internal API, which isn't officially supported for outside use, so it doesn't count.
- Database choices 3
3/5 means: A built-in database or one kind of database server
The database type can be SQLite or MariaDB.
Evidence and sources
Self-hosted uptime monitors scores
Components to run 3 quotes
-
“docker run -d --restart=always -p 3001:3001 -v uptime-kuma:/app/data --name uptime-kuma louislam/uptime-kuma:2”
github.com/louislam/uptime-kuma · checked -
“Node.js >= 20.4”
github.com/louislam/uptime-kuma · checked -
“Database Type sqlite, mariadb”
github.com/louislam/uptime-kuma/wiki/Environment-Variables · checked
What it can check 2 quotes
-
“Monitoring uptime for HTTP(s) / TCP / HTTP(s) Keyword / HTTP(s) Json Query / Websocket / Ping / DNS Record / Push / Steam Game Server / Docker Containers”
github.com/louislam/uptime-kuma · checked -
“Certificate info”
github.com/louislam/uptime-kuma · checked
Fastest check interval 1 quote
-
“20-second intervals”
github.com/louislam/uptime-kuma · checked
Alert channels 1 quote
-
“Notifications via Telegram, Discord, Gotify, Slack, Pushover, Email (SMTP), and 90+ notification services”
github.com/louislam/uptime-kuma · checked
Public status pages 4 quotes
-
“Multiple status pages”
github.com/louislam/uptime-kuma · checked -
“Map status pages to specific domains”
github.com/louislam/uptime-kuma · checked -
“Pinned incident object or null”
github.com/louislam/uptime-kuma/wiki/Internal-API · checked -
“Show a maintenance message on status pages.”
github.com/louislam/uptime-kuma/wiki/Maintenance · checked
Ways to manage monitors 4 quotes
-
“Fancy, Reactive, Fast UI/UX”
github.com/louislam/uptime-kuma · checked -
“This API is primarily designed for the application's own use and is not officially supported for third-party integrations.”
github.com/louislam/uptime-kuma/wiki/Internal-API · checked -
“Backing up the data directory is currently the only supported backup method.”
github.com/louislam/uptime-kuma/wiki/Migration-From-v1-To-v2 · checked -
“Removed deprecated feature Backup/Restore from JSON”
github.com/louislam/uptime-kuma/wiki/Migration-From-v1-To-v2 · checked
Sign-in and users 3 quotes
-
“2FA support”
github.com/louislam/uptime-kuma · checked -
“The API key cannot be used to access the web interface but you should treat API keys like you treat your passwords as they can still be used to access potentially sensitive data.”
github.com/louislam/uptime-kuma/wiki/Prometheus-API-Keys · checked -
“Add basic multiple admin users support”
github.com/louislam/uptime-kuma/pull/3571 · checked
Getting data out 5 quotes
-
“If you already use Prometheus.io or a platform that supports Prometheus exporter format, you can get the metrics about each monitoring target from”
github.com/louislam/uptime-kuma/wiki/Prometheus-Integration · checked -
“These are the endpoints that return an SVG graphic for a given (public) monitor:”
github.com/louislam/uptime-kuma/wiki/Badge · checked -
“The API key cannot be used to access the web interface but you should treat API keys like you treat your passwords as they can still be used to access potentially sensitive data.”
github.com/louislam/uptime-kuma/wiki/Prometheus-API-Keys · checked -
“This API is primarily designed for the application's own use and is not officially supported for third-party integrations.”
github.com/louislam/uptime-kuma/wiki/Internal-API · checked -
“It also provides RESTful API endpoints for push monitors, status badges, Prometheus metrics, and public status page data.”
github.com/louislam/uptime-kuma/wiki/Internal-API · checked
Database choices 1 quote
-
“Database Type sqlite, mariadb”
github.com/louislam/uptime-kuma/wiki/Environment-Variables · checked
Facts
License 1 quote
-
“MIT License”
github.com/louislam/uptime-kuma/blob/master/LICENSE · checked
Runs on 3 quotes
-
“docker run -d --restart=always -p 3001:3001 -v uptime-kuma:/app/data --name uptime-kuma louislam/uptime-kuma:2”
github.com/louislam/uptime-kuma · checked -
“Major Linux distros such as Debian, Ubuntu, Fedora and ArchLinux etc.”
github.com/louislam/uptime-kuma · checked -
“Windows 10 (x64), Windows Server 2012 R2 (x64) or higher”
github.com/louislam/uptime-kuma · checked
Needs 1 quote
-
“Node.js >= 20.4”
github.com/louislam/uptime-kuma · checked
Notability
Users 1 quote
-
“100M+”
hub.docker.com/r/louislam/uptime-kuma · checked
Other quotes
Not cited by a score or fact 5 quotes
-
“Uptime Kuma is an easy-to-use self-hosted monitoring tool.”
github.com/louislam/uptime-kuma · checked -
“tag_name: 2.5.9, published_at: 2026-10-31T16:03:58Z”
api.github.com/repos/louislam/uptime-kuma/releases/latest · checked -
“Temporary disable notifications during a time window”
github.com/louislam/uptime-kuma/wiki/Maintenance · checked -
“File Systems like NFS (Network File System) are NOT supported. Please map to a local directory or volume.”
github.com/louislam/uptime-kuma · checked -
“Breaking changes may occur between versions without prior notice.”
github.com/louislam/uptime-kuma/wiki/Internal-API · checked