Uptime Kuma, Kener, Gatus and Checkmate each check your websites, APIs and machines on a schedule from a server you run, message you when something stops answering, and can publish a status page. All four are open source, run in Docker, and had each published a release in the four weeks before we checked them in early November 2026, so the choice comes down to how you’d work with them. Four questions sort it out:
- Will you set up monitors by clicking through a web dashboard, or by writing them in a file you keep in Git?
- Is the status page mainly for you, or for customers who expect incident updates?
- Do you want CPU, memory and disk use from your servers next to the uptime checks?
- Will several people need their own logins?
Our default for a home lab or a handful of small sites is Uptime Kuma, and each of the others wins on one of those questions.
Scores
1–5 per criterion · select a score for its reasoning and sources| # | Product | Components to run | What it can check | Fastest check interval | Alert channels | Public status pages | Ways to manage monitors | Sign-in and users | Getting data out | Database choices | Overall |
|---|---|---|---|---|---|---|---|---|---|---|---|
| 1 | Uptime Kuma | 4 | 3 | 4 | 5 | 4 | 1 | 3 | 4 | 3 | 3.4 |
| 2 | Kener | 3 | 4 | 3 | 1 | 4 | 2 | 4 | 4 | 4 | 3.2 |
| T3 | Gatus | 4 | 2 | 5 | 4 | 1 | 1 | 3 | 4 | 3 | 3.0 |
| T3 | Checkmate | 3 | 4 | 5 | 3 | 2 | 4 | 3 | 2 | 1 | 3.0 |


How each criterion is scored
Components to run
What a minimal install needs before the first check runs: the monitor itself plus any separate service it requires, such as a database server or a cache. Optional services don't count.
- 5 One downloadable program with storage built in and nothing else to install
- 4 One container with storage built in; installing without a container needs a separately installed language runtime or build tool
- 3 The app plus one required service, such as a database server or a cache
- 2 The app plus two required services
- 1 The app plus three or more required services
What it can check
How many of nine kinds of check the documentation lists: an HTTP(S) request that checks the response content, an open TCP port, ping (ICMP), a DNS record, TLS certificate expiry, a heartbeat that a cron job or script sends in (push), a query against a database server, a Docker container's state, and a server's CPU, memory and disk use.
- 5 All nine
- 4 Eight of the nine
- 3 Seven of the nine
- 2 Six of the nine
- 1 Five or fewer of the nine
Fastest check interval
The shortest time between two checks of the same service that the documentation states or shows as possible. A shorter interval notices an outage sooner.
- 5 15 seconds or less
- 4 16 to 59 seconds
- 3 1 minute
- 2 2 to 5 minutes
- 1 Longer than 5 minutes
Alert channels
How many notification services the monitor can send alerts to without extra software (email, Slack, Telegram, PagerDuty, a generic webhook and so on), counted from the project's own list.
- 5 50 or more
- 4 25 to 49
- 3 10 to 24
- 2 5 to 9
- 1 Fewer than 5
Public status pages
How many of five status-page features are documented: several status pages from one install, a status page on its own domain, incident notices posted on the page, scheduled maintenance shown on the page, and a way for visitors to subscribe to updates (email or RSS).
- 5 All five
- 4 Four of the five
- 3 Three of the five
- 2 Two of the five
- 1 None or one of the five
Ways to manage monitors
How many of five ways to create and change monitors are documented: forms in the web interface, text configuration files, an HTTP API the project supports for creating or changing monitors, importing monitors from a file, and exporting them to a file. An API the project calls internal or unsupported doesn't count.
- 5 All five
- 4 Four of the five
- 3 Three of the five
- 2 Two of the five
- 1 One of the five
Sign-in and users
How many of four sign-in and user features are documented: a login that protects the dashboard, two-factor login, single sign-on through an outside identity provider (OpenID Connect, SAML or LDAP), and several user accounts with roles that limit what each can change.
- 5 All four
- 4 Three of the four
- 3 Two of the four
- 2 One of the four
- 1 None of the four
Getting data out
How many of four ways to use monitoring results elsewhere are documented: a Prometheus metrics endpoint with per-monitor results, an HTTP API the project supports for reading monitor status and history, status or uptime badges to embed in other pages, and API keys or tokens for scripts that are separate from user passwords.
- 5 All four
- 4 Three of the four
- 3 Two of the four
- 2 One of the four
- 1 None of the four
Database choices
Where the monitor can keep its data: a database built into the app (such as SQLite) and which kinds of separate database server it supports. More choices let you use a database you already run and back up.
- 5 A built-in database or three or more kinds of database server
- 4 A built-in database or two kinds of database server
- 3 A built-in database or one kind of database server
- 2 Only a built-in database, with no separate server option
- 1 Only one kind of database, which runs as a separate server
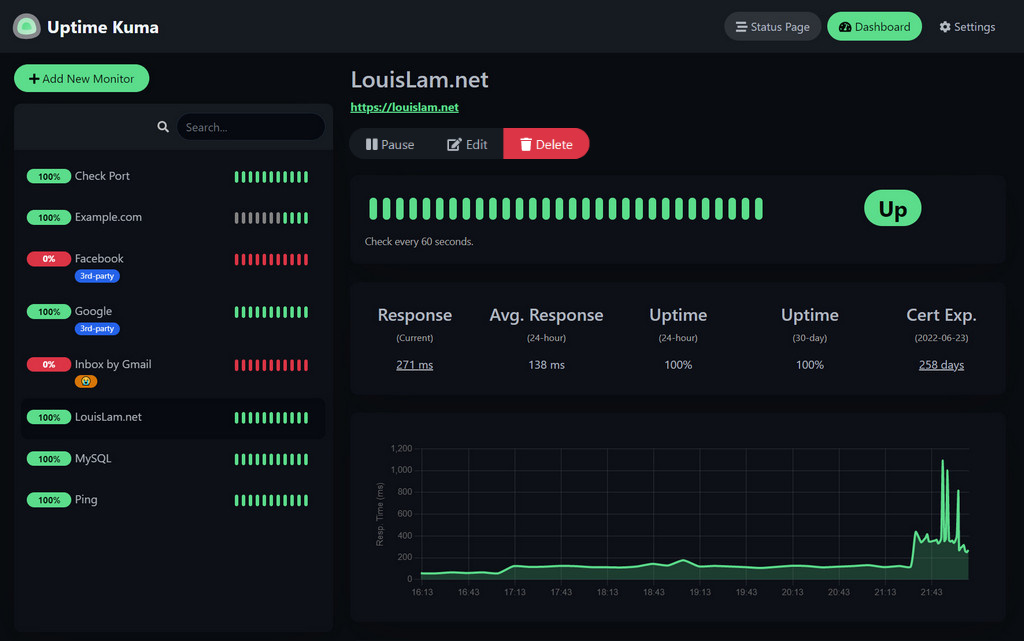
Uptime Kuma is a monitor you set up entirely in the browser, and it’s what we’d install first if you run a home lab or a few small sites and want to hear about outages on the app you already use. One docker run command starts it, and data lives in a mounted folder with SQLite, or in MariaDB if you prefer.
Its strongest point is alerts. The README counts more than 90 notification services, the longest list of the four, so whatever your phone or team chat uses is almost certainly covered. Checks can repeat every 20 seconds.
The trade-offs show up over years rather than on day one. The move to the current major version removed backup and restore from JSON, so copying the data folder is now the only supported backup, and the docs describe no other way to export your monitors. If you want to script changes or connect other tools, the API behind the dashboard is internal, not officially supported, and may change between versions without notice. There is one login: support for several admin users is the subject of a pull request, not a documented feature.

What it does
- HTTP(S) with keyword and JSON checks, TCP, ping, DNS, push, Docker containers and Steam game servers
- 90+ notification services, including Telegram, Discord, Slack and email
- Several status pages, each on its own domain
- Maintenance windows that mute alerts and show a message on status pages
- Metrics for Prometheus, a widely used metrics database, and SVG status badges
Pros
- The widest choice of alert services of the four
- One container with SQLite, set up from the browser
- Two-factor login
Cons
- The docs describe no supported API and no way to export monitors
- No documented support for separate user accounts or roles
Who should skip:Teams that need separate logins with different permissions.
Kener calls itself a status page system, and that is the job it does best. We’d recommend it when the page your users see matters more than how many places alerts can go, because it does the communication side more fully than the others: incidents carry a public timeline of updates, scheduled maintenance is announced ahead of time, and visitors can subscribe by email or follow an RSS feed. One gap for a customer-facing page: the docs don’t describe giving a status page its own domain, which Uptime Kuma and Checkmate both document.
It monitors more than the label suggests. Monitors cover HTTP APIs, ping, TCP, DNS, certificate expiry, SQL queries, heartbeats and Docker containers, and you can create them from the admin panel or through its REST API with API keys. Sign-in covers local accounts and OpenID Connect, which lets people log in through an identity provider such as Keycloak or Okta, with roles you can define yourself.
It is slower to notice an outage than the others can be. Checks run on cron expressions, the scheduling format Unix systems use, and the shortest step the docs show is one minute, where Uptime Kuma goes down to 20 seconds and Checkmate to 15.

What it does
- Several status pages from one install
- Incidents with a public update timeline, and scheduled maintenance
- Email subscriptions and an RSS feed for visitors
- API, ping, TCP, DNS, SSL, SQL, heartbeat and Docker monitors, plus game-server checks through the GameDig query library
- REST API with API keys, plus badges and embeds
Pros
- The fullest set of status page tools for keeping customers informed
- Single sign-on through OpenID Connect and custom roles
- Stores data in SQLite, PostgreSQL or MySQL
Cons
- Alerts reach only webhook, Discord, Slack and email
- Needs Redis, an in-memory data store, running next to the app
Who should skip:Anyone who wants alerts on Telegram, PagerDuty or SMS without writing a webhook.
Gatus
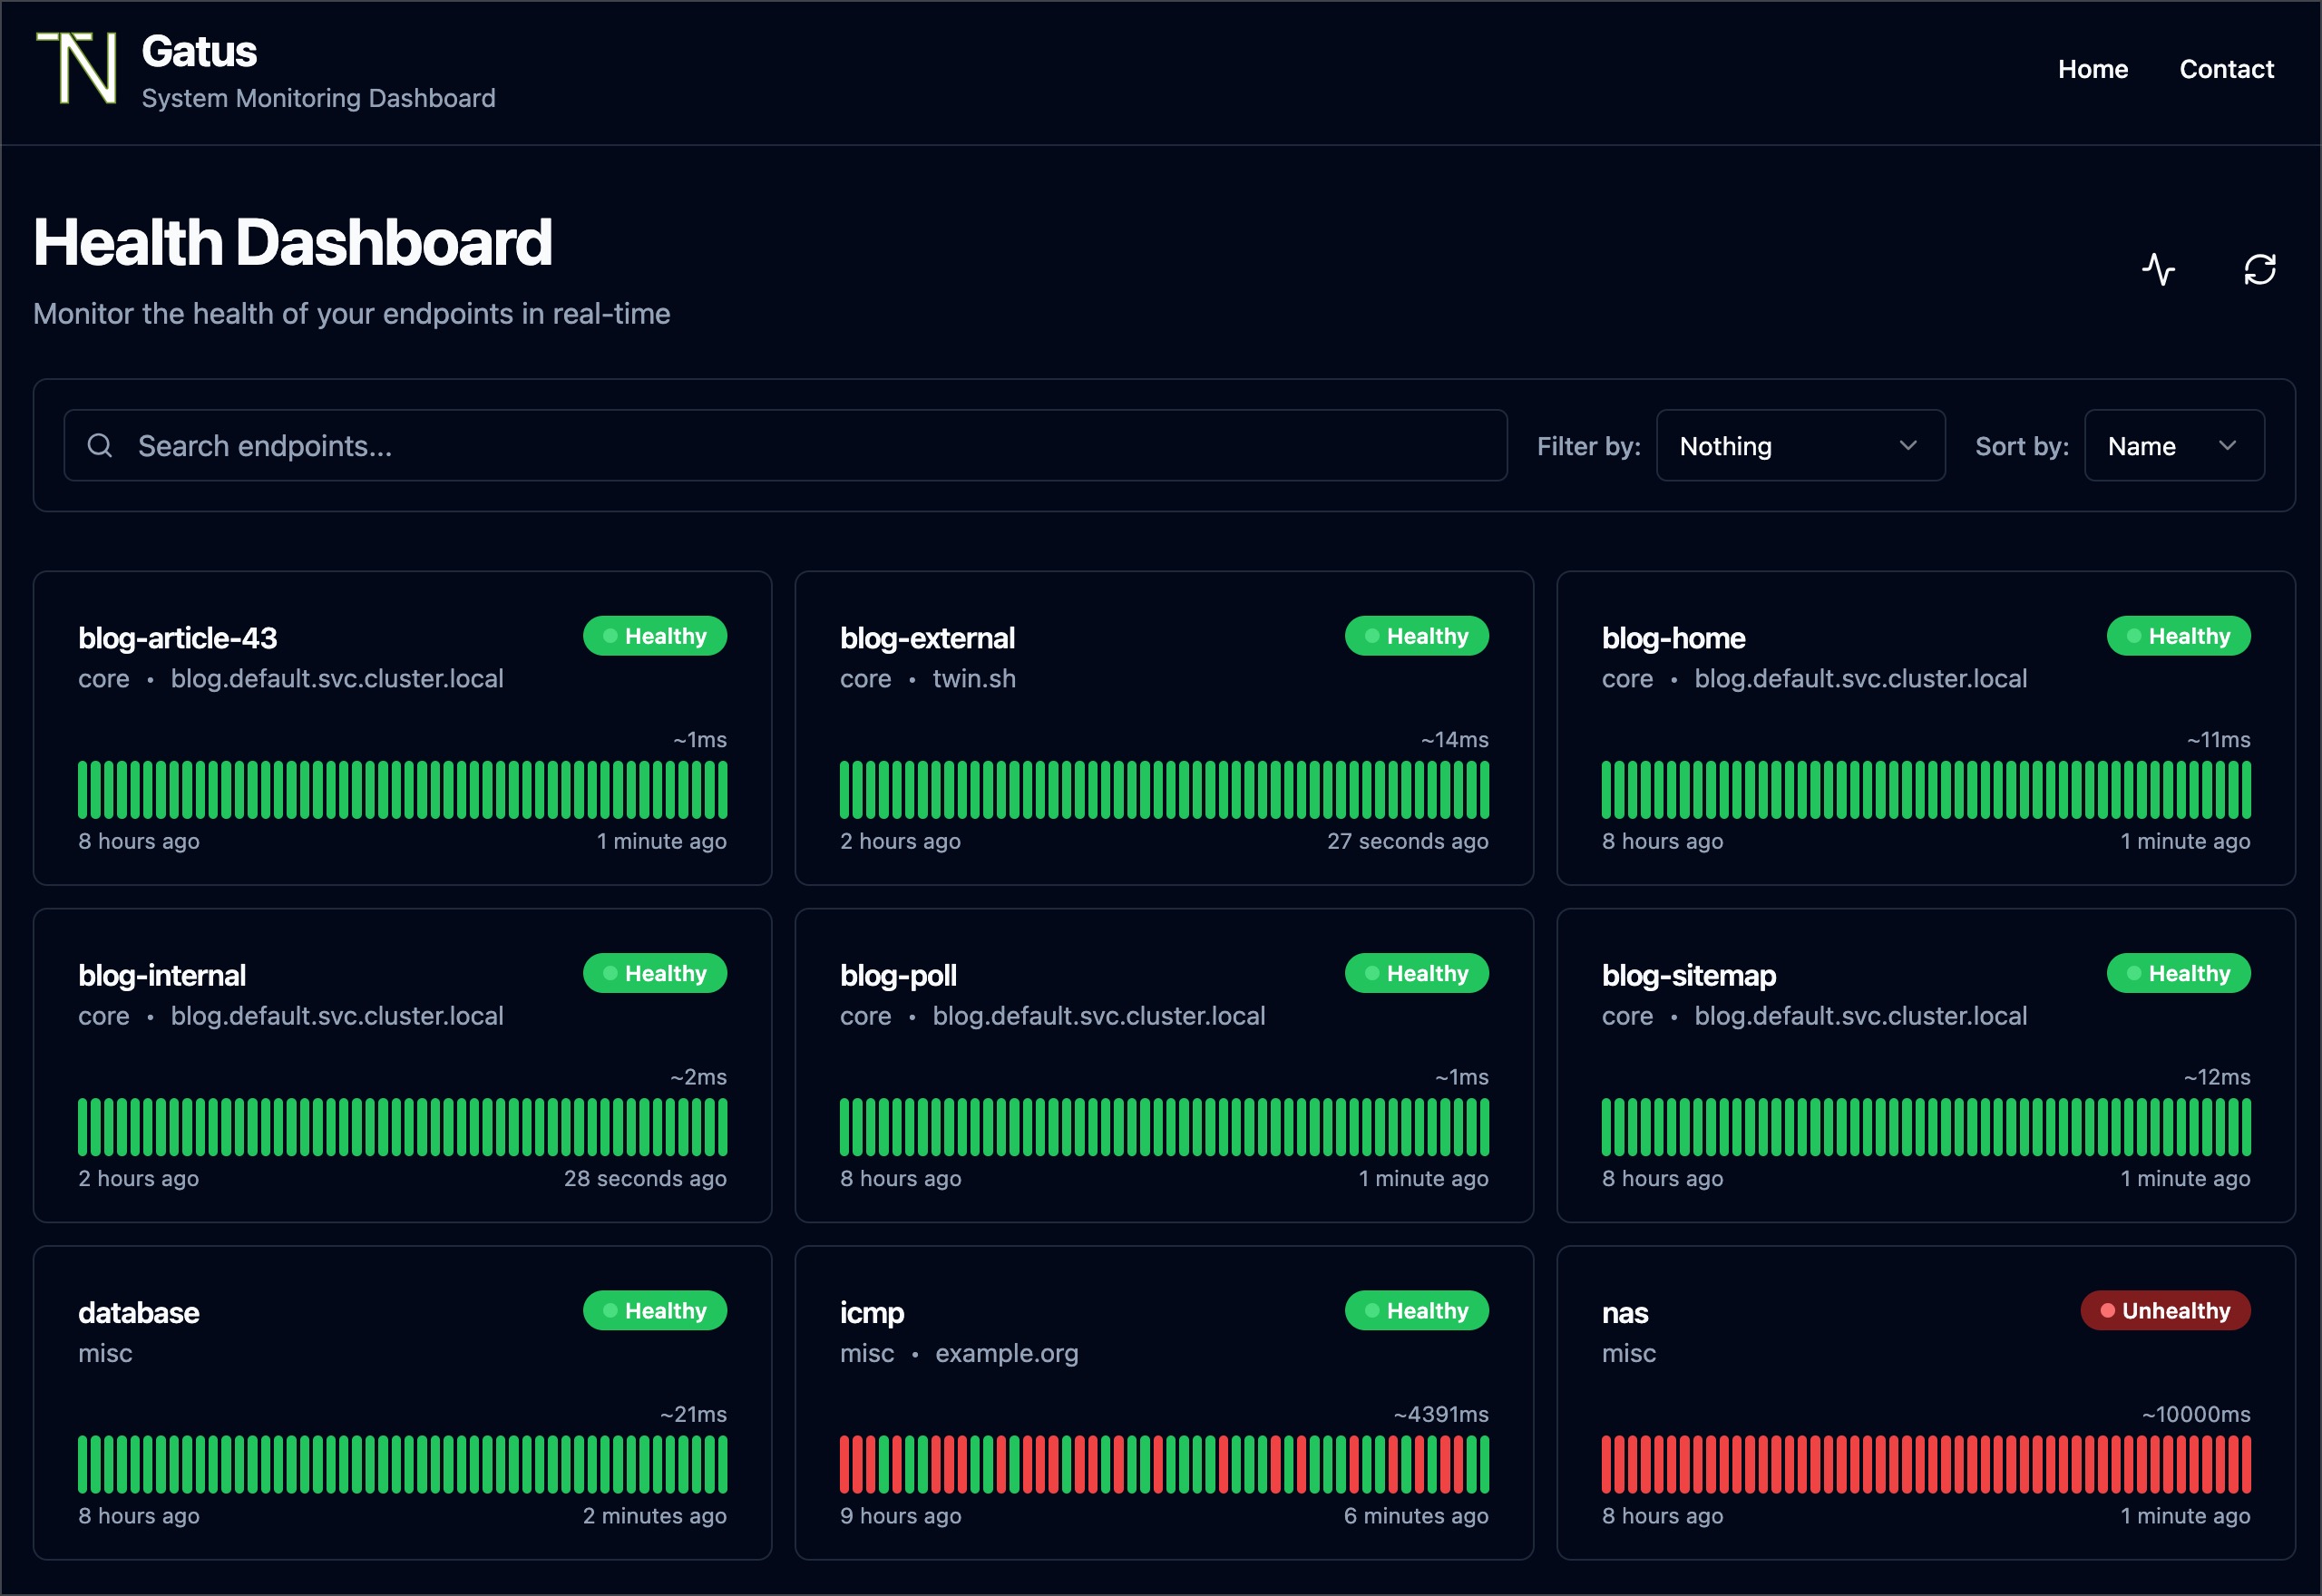
If your monitors live in GitGatus is for people who would rather write a monitor than click one together. Every endpoint goes in a YAML file with conditions on the status code, response time, body, certificate expiry or even domain expiry. Those conditions check what a page or API returns as well as whether it answers, and the README suggests using Gatus for automated user acceptance tests. That file is the whole setup, which makes Gatus the easiest of the four to rebuild, review or move: it is already text you can keep in version control.
It is also light: the README calls its footprint “negligibly small”, and it runs as one container with no database server. It says it can handle any interval, though it advises longer intervals for slow checks, and its author uses 30 seconds for simple ones. Alerts can go to a long list of providers, from AWS SES and Gotify to Slack, PagerDuty and Zulip, plus custom alerts, and a read-only API, Prometheus metrics and badges let other tools use the results.
What you give up is the dashboard as a place to work. The docs describe no way to edit monitors in the browser, and no status page features beyond announcements shown at the top of the page. Sign-in is Basic authentication, the browser’s own username-and-password prompt, or OpenID Connect, and the docs describe no user roles. They also list no database query or Docker container checks; Kener documents both, and Checkmate documents Docker checks.

What it does
- HTTP, ICMP, TCP and DNS checks with conditions on status, response time, body and certificate expiry
- External endpoints that scripts push results to, with a heartbeat deadline
- Alerting through dozens of providers plus custom alerts
- Read-only API, Prometheus metrics and SVG badges
- Storage in memory, SQLite or PostgreSQL
Pros
- Monitors are text in a YAML file, easy to keep in Git and copy to a new server
- Small footprint: one container with no database server
- Any check interval, with the README's advice to give slow checks longer ones
Cons
- Every change is an edit to the config file; the docs describe no web editor
- The docs describe only announcements on its status page, with no incident timelines or subscriptions
- The docs list no database or Docker container checks
Who should skip:Anyone who wants to add and change monitors from a web dashboard.
Checkmate
If you also watch server resourcesCheckmate is an uptime monitor that also watches the servers themselves: with its Capture agent installed on a machine, it tracks CPU, memory and disk next to your uptime checks. We’d recommend it to a small team that runs its own servers. It has three user roles, so colleagues can watch the dashboards while only admins change monitors.
Its checks reach further than most. They can run as often as every 15 seconds, and geo checks send the same request from other locations every 5 to 30 minutes, so you can tell a regional outage from a global one; the docs don’t say whose machines those locations are. The project says one deployment monitors more than 1,600 servers in production.
Moving to a new server is straightforward: export every monitor’s settings to a JSON file and import it into the new Checkmate install. A REST API, documented on an interactive Swagger page, can create monitors too.
Its weaker side is outward-facing. Alerts reach 13 services, fewer than Uptime Kuma or Gatus. Its docs also describe no Prometheus metrics or badges for monitors, and no incident notices or subscriptions on its status pages.

What it does
- HTTP with certificate expiry, ping, port, DNS, Docker, gRPC, WebSocket, game server and heartbeat monitors
- CPU, memory and disk monitoring through the Capture agent
- Geo checks from several locations
- Status pages on your own domain
- Monitor export and import as JSON
Pros
- Server resource monitoring alongside uptime
- Separate logins with User, Admin and Superadmin roles
Cons
- Requires MongoDB, a separate database server
- Sends an anonymous usage report once a day unless you set
TELEMETRY_ENABLED=false - OpenID Connect sign-in is a feature request, not a documented feature
Who should skip:Anyone running it on a machine with less than 1 GB of memory.
How to choose
Gatus and Checkmate come out level in the table, but they suit opposite readers: Gatus someone who keeps everything in files and wants a light install, Checkmate a team that wants a dashboard, separate logins and server metrics.
- You want alerts on the app you already use, set up in a browser: Uptime Kuma.
- Customers read your status page and expect incident updates: Kener.
- Your setup lives in Git: Gatus.
- You want CPU, memory and disk use next to uptime: Checkmate.
- Several people need their own logins: Kener or Checkmate, which both have user roles. Kener and Gatus can also sign people in through OpenID Connect.
Our picks
Also considered
- Statping-ng
Its latest release on GitHub came out in June 2025, so we ranked monitors that have had releases since.
- Peekaping
Its README says it is in beta, that features may change, and that you should try it outside production first.
Questions
Can these monitor cron jobs and backups?
Yes. All four accept results that your own job sends in when it runs: Uptime Kuma calls these push monitors, Gatus calls them external endpoints, and Checkmate and Kener call them heartbeat monitors. Checkmate and Gatus document that a missing report within the expected interval counts as a failure.
Can I check my site from more than one place?
Checkmate’s geo checks do this from its own settings. Gatus has an experimental feature that pulls endpoint statuses from another Gatus instance, so a second copy on another network can report into one dashboard. With any of the four, a script running elsewhere can send its results in as a heartbeat.
How we scored
Every score cites quotes from each product's own documentation, website and release notes, or from trusted third parties, captured in November 2026. Each criterion counts the same, and a criterion the evidence doesn't cover is shown as "?" and left out of that product's overall score.
Criteria that count features only count what each project documents, so a feature missing from the documentation may still exist.