
Statsig
Product analytics and feature delivery built around measured experiments
Our verdict
#2 of 9 in Product analytics tools · For teams whose next question becomes an experiment
Pros
- Analytics and live experiment summaries share dashboards
- Group analytics is included without a separate add-on
- Free includes core analysis and a substantial session replay allowance
Cons
- Metered usage can include experiment exposures and extra dimensions
- Cloud daily metrics do not automatically incorporate late data
Who should skip: Teams that rely on routine historical backfills into already computed Cloud metrics.
Rankings and alternatives



Product analytics tools scores
Evaluated Nov 9, 2026 Evidence ↓- Self-service exploration 4
4/5 means: Connected drill-down and reusable analyses let a team pursue follow-up questions
Chart switching keeps selected event context, and dashboards reuse charts and live experiment summaries. Shared metric definitions across different report types are not fully settled in the selected passages.
Rests partly on what the sources don't mention, which is a weaker signal than what they say.
- Tracking without repeated code changes 4
4/5 means: Automatic collection of interactions such as clicks and forms
SDK autocapture records interactions and metadata; retroactive visual event definition is not established by this source.
Rests partly on what the sources don't mention, which is a weaker signal than what they say.
- Investigating sessions 5
5/5 means: Connected recordings with developer diagnostics such as console, network or error context
Matching analyses, events or experiment exposures lead to session recordings, with console/network diagnostic context documented directly.
- Useful ongoing free plan 4
4/5 means: At least a million monthly events, with a core report, cohort or saved-report restriction
Developer has two million metered events and core analytics; advanced analytics requires Pro.
- Analysis of customer accounts 4
4/5 means: Native group or account conversion funnels
Funnels support user or company IDs and group analysis is included on every tier; full account-retention coverage is not established here.
Rests partly on what the sources don't mention, which is a weaker signal than what they say.
- Control over deployment 4
4/5 means: Supported analysis running against a customer data warehouse
Enterprise can run analysis in the customer data warehouse; that differs from operating the complete application on-premise.
- Testing product changes 5
5/5 means: Native feature experiments with advanced statistical methods such as variance reduction or multiple statistical approaches
Experimentation is core to the platform, with advanced experiment methods on paid tiers. The pricing feature table lists CUPED, sequential testing and bandits.
- Acting through in-app guidance unknown
Direct searches for Statsig in-app guidance and surveys did not establish a usable capability quote. Native guidance remains unknown, not absent.
Pricing
- Developer Free 2 million metered events and 50,000 monthly session replays; one-year analytics retention.
- Pro $150.00 /month USD per month with 5 million metered events and 100,000 replays; additional events billed by usage.
- Enterprise Contact sales Custom pricing; warehouse-native deployment and governance options.
From the vendor’s pricing page, checked Nov 9, 2026. That page is authoritative.
Evidence and sources
Product analytics tools scores
Self-service exploration 2 quotes
-
“In Metrics Explorer, charts are the primary means of analysis, providing a detailed look at your data. You can switch between chart types from the top-left section of the interface while maintaining context on the selected events. Switching chart types lets you focus on a particular metric or event while exploring it from different angles.”
docs.statsig.com/product-analytics/overview · checked -
“Dashboards let you share insights and information with your team. You can save any chart you build to a dashboard. You can also save a snapshot of Feature Gates, A/B tests, and experiments to dashboards. Experiment and feature gate snapshots sync automatically to a dashboard, keeping your team up to date with relevant launches as they emerge. Statsig auto-populates these dashboards with any entity matching the tags you specify.”
docs.statsig.com/product-analytics/overview · checked
Tracking without repeated code changes 1 quote
-
“The JavaScript, React, and Angular SDKs support autocapture, which automatically captures events and their attributes without requiring you to manually instrument your code.”
docs.statsig.com/webanalytics/autocapture · checked
Investigating sessions 2 quotes
-
“View session replays and user event streams in the context that they matter to understand the why behind user actions and experiment results.”
statsig.com/pricing · checked -
“Watch and explore captured sessions in Statsig Session Replay, including event timelines, network activity, console logs, and gate exposures.”
docs.statsig.com/session-replay/watch · checked
Useful ongoing free plan 2 quotes
-
“2M events per month Unlimited flag & config checks 50,000 session replays per month Start for Free Get started with: A/B tests & experimentation Feature flags & config management Product and web analytics 1-year analytics retention Session replays Unlimited seats Pro”
statsig.com/pricing · checked -
“All tiers of Statsig includes core product analytics capabilities. On the free tier that includes our Core Product Analytics features and 1 year of data retention for analysis. On the pro-tier, Full-Featured Statsig product analytics is included at no extra cost. This includes access to all product analytics features and unlimited data retention for analysis. On the enterprise tier, we want to provide the flexibility to pick what makes the most sense for your business.”
statsig.com/pricing · checked
Analysis of customer accounts 2 quotes
-
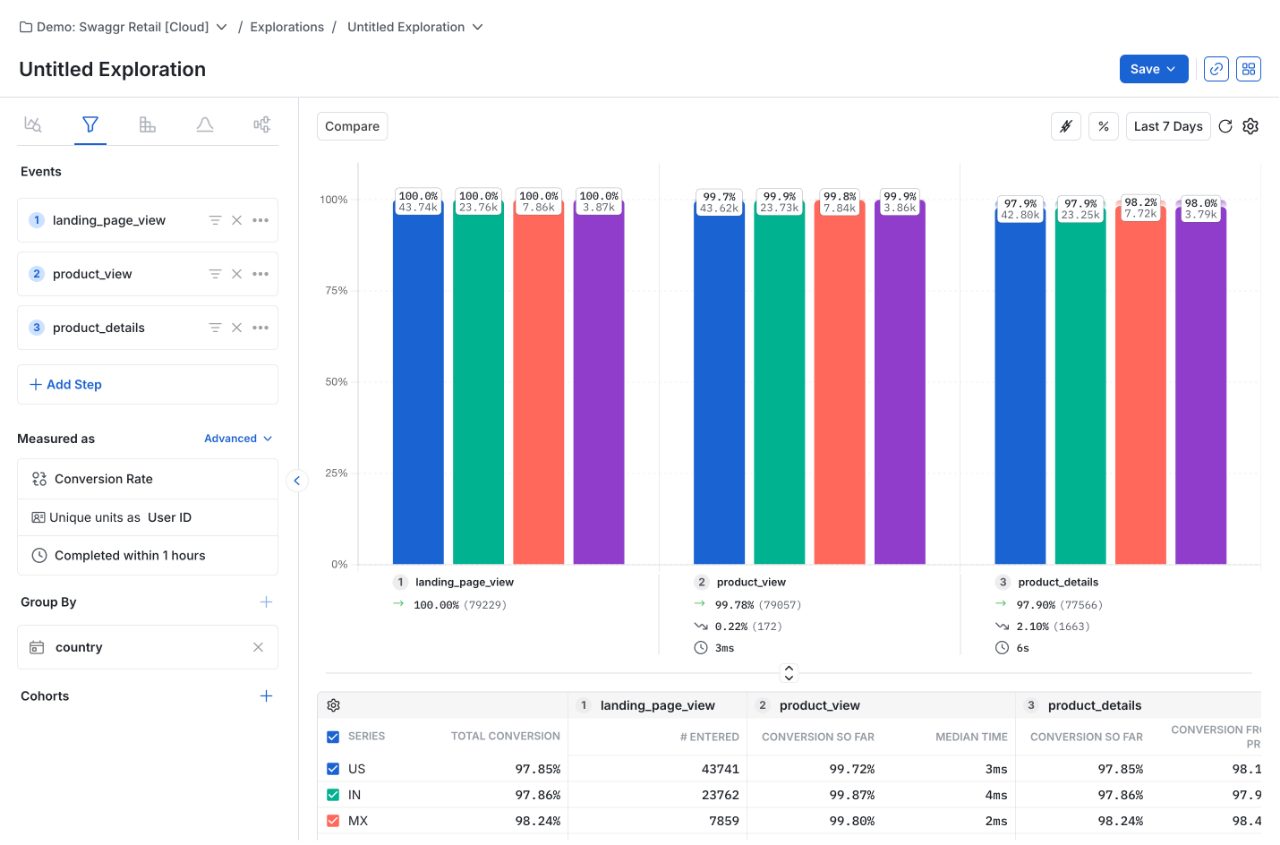
“Statsig supports individual or group analytics, letting you analyze funnel success at the user level or for whole groups such as organizations or companies.”
docs.statsig.com/product-analytics/funnels · checked -
“Group analytics isn't a paid add-on at Statsig, and comes at no extra cost for all tiers.”
docs.statsig.com/product-analytics/funnels · checked
Control over deployment 1 quote
-
“Deploy Statsig in your data warehouse, including Snowflake, Databricks, BigQuery, Redshift, Athena, and Fabric”
statsig.com/pricing · checked
Testing product changes 3 quotes
-
“$150 /mo 5M events included, then $0.05 per 1K events Unlimited flag & config checks 100,000 session replays per month Get Started Everything in Developer, plus: Advanced experimentation Advanced product analytics Unlimited analytics retention Change reviews & approvals API controls”
statsig.com/pricing · checked -
“Dashboards let you share insights and information with your team. You can save any chart you build to a dashboard. You can also save a snapshot of Feature Gates, A/B tests, and experiments to dashboards. Experiment and feature gate snapshots sync automatically to a dashboard, keeping your team up to date with relevant launches as they emerge. Statsig auto-populates these dashboards with any entity matching the tags you specify.”
docs.statsig.com/product-analytics/overview · checked -
“Breakdown the impact of all experiments and features on a specific metric Advanced statistical techniques CUPED CUPED Method to reduce experiment runtime and increase accuracy with historical data Bonferroni Correction Bonferroni Correction”
statsig.com/pricing · checked
Facts
License 1 quote
-
“Subject to the limited rights expressly granted hereunder, Statsig alone (and its licensors, where applicable) will retain all rights, title, and interest in and to the Services and data relating to the Services (other than Customer Data as defined herein), including all related Intellectual Property Rights. In addition, Statsig will own all Intellectual Property Rights in and to any suggestions, ideas, enhancement requests, feedback, recommendations or other information (collectively, “Feedback”) provided by Customer or any third party relating to the Services. Statsig may, in its sole discretion, incorporate any Feedback into the Services. Customer will not copy, distribute, reproduce or use any of the foregoing except as expressly permitted under this SSA. This SSA is not a sale and does not convey to Customer any rights of ownership in or related to the Services or any Intellectual Property Rights. “Intellectual Property Rights” means unpatented inventions, patent applications, patents, design rights, copyrights, trademarks, service marks, trade names, domain name rights, mask work rights, know-how and other trade secret rights, licenses and all other intellectual property rights, derivatives thereof, and forms of protection of a similar nature anywhere in the world.”
statsig.com/terms · checked
Runs on 1 quote
-
“The JavaScript, React, and Angular SDKs support autocapture, which automatically captures events and their attributes without requiring you to manually instrument your code.”
docs.statsig.com/webanalytics/autocapture · checked
Needs 1 quote
-
“The JavaScript, React, and Angular SDKs support autocapture, which automatically captures events and their attributes without requiring you to manually instrument your code.”
docs.statsig.com/webanalytics/autocapture · checked
Other quotes
Not cited by a score or fact 6 quotes
-
“Statsig offers the following chart types: Metric Drilldown Funnels Retention Distribution User Journeys Lifecycle”
docs.statsig.com/product-analytics/overview · checked -
“Conversion Drivers identify statistically significant factors that correlate with funnel conversion or drop-off at each step. The analysis surfaces event properties, user properties, and intermediary events that influence user progression through the funnel.”
docs.statsig.com/product-analytics/funnels · checked -
“By default, customers are able to include one event dimension (via Value field) with each log event for free. Customers are charged an additional log event for each additional dimension added.”
statsig.com/pricing · checked -
“If events for a given day arrive after that day's computation has already run, Statsig doesn't automatically include them in the already-computed metric value. Statsig doesn't update the stored metric for that day to reflect late-arriving data.”
docs.statsig.com/metrics/how-metrics-work · checked -
“Exposure: When an application calls the Statsig SDK to check whether a user should be exposed to an experiment or a feature flag with Metric Lifts enabled.”
statsig.com/pricing · checked -
“Statsig Session Replay captures user sessions for playback in the console. Watch any recorded session, step through event timelines, and filter replays by event, user, Feature Gate exposure, or Experiment exposure. To find your replays, go to the Users group in the Statsig console navigation panel.”
docs.statsig.com/session-replay/watch · checked
Pricing
statsig.com/pricing · checked