People sign up for your app, but what happens next? Product analytics can show whether they finish setup, which features they use, and whether they return. That helps a team spot where to investigate; the data alone can’t prove why someone stayed or left.
Amplitude is our pick for most product teams. It lets colleagues reuse definitions of important metrics across reports, so they can investigate the same problem without each measuring success differently. Its free plan is a useful start, though saving groups of users based on their behavior requires a paid plan.
The choice gets more interesting when the team needs to act on what it finds. PostHog connects analytics with recordings and tools for releasing changes; Statsig is particularly appealing for frequent experiments. Pendo adds in-app guidance for teams trying to improve onboarding.
Heap is known for automatically collecting interactions so a team can ask questions about them later. That’s useful, but it isn’t unique to Heap: Amplitude, PostHog, Pendo, and Fullstory also support retrospective analysis of collected interactions. The better question is how the team wants to use the information once it has it.
An event is an action such as a page view or button click. A session is a visit, which can contain many events; retention measures whether users return over time. Pendo and Countly use monthly active users as a pricing unit instead of events or sessions, so the biggest-looking free allowance isn’t necessarily the one that covers the most customers.
| Product | Especially useful for | Free managed plan | When you need more |
|---|---|---|---|
| Amplitude | Shared product reporting | 2 million events/month; no saved behavioral groups | Plus is usage-based; Growth and Enterprise are quoted |
| Statsig | Teams that run experiments | 2 million metered events and 50,000 session recordings/month | Pro is $150/month with 5 million metered events |
| PostHog | Engineering teams investigating and shipping changes | 1 million events and 5,000 session recordings/month | Usage-based, with separate charges for products and add-ons |
| Pendo | Analytics plus in-app guidance | Up to 500 monthly active users; no Data Explorer or session replay | Paid plans are quoted; Core includes session replay |
| Mixpanel | Self-service conversion and retention reports | 1 million events, 10,000 session recordings/month, and five saved reports per seat | Growth is usage-based; company-level analysis costs extra |
| Fullstory | Investigating sessions behind a problem | 30,000 sessions/month, basic analytics and session replay; no dashboards | Paid plans are quoted; retention analysis requires Advanced or Enterprise |
| Countly | Supported private installation | 14-day trial for Flex | Flex with Intelligence starts at $219/month for 5,000 active users |
| Heap | Defining events from collected interactions | 10,000 sessions/month and six months of history | Paid plans depend on sessions; session replay is an add-on on Pro and Premier |
| OpenPanel | Web and product analytics together | 30-day trial; free cloud for qualifying open-source projects | Cloud starts at $2.50/month for 5,000 events |
Prices and plan limits as of November 2026. Countly’s figure includes the Intelligence add-on needed for funnels and retention, before regional or other extras.
Scores
1–5 per criterion · select a score for its reasoning and sources| # | Product | Self-service exploration | Tracking without repeated code changes | Investigating sessions | Useful ongoing free plan | Analysis of customer accounts | Control over deployment | Testing product changes | Acting through in-app guidance | Overall |
|---|---|---|---|---|---|---|---|---|---|---|
| 1 | Amplitude | 5 | 5 | 5 | 4 | 5 | 2 | 4 | 5 | 4.4 |
| 2 | Statsig | 4 | 4 | 5 | 4 | 4 | 4 | 5 | unknown | 4.3* |
| 3 | PostHog | 4 | 5 | 5 | 5 | 5 | 2 | 5 | 2 | 4.1 |
| 4 | Pendo | 3 | 5 | 5 | 3 | 5 | 2 | 3 | 5 | 3.9 |
| 5 | Mixpanel | 5 | 4 | 5 | 4 | 5 | 2 | 4 | 1 | 3.8 |
| 6 | Fullstory | 4 | 5 | 5 | 2 | 2 | 2 | 3 | 5 | 3.5 |
| 7 | Countly | 4 | 2 | unknown | 1 | 2 | 5 | 4 | 4 | 3.1* |
| 8 | Heap | 3 | 5 | 3 | 3 | 4 | 2 | 2 | unknown | 3.1* |
| 9 | OpenPanel | 4 | 3 | 3 | 1 | 3 | 5 | 1 | unknown | 2.9* |








Equal displayed overall scores are ordered by the earlier criteria; a known score comes before an unknown score. Identical scores use alphabetical order.
? = the product’s sources don’t say. * = the overall score averages only the known criteria.
How each criterion is scored
Self-service exploration
Judged from report-building, follow-up analysis and sharing workflows, with independent review signals where available. This judges how readily a product teammate can pursue a question, not the number of features or a claim of first-hand use.
- 5 Teammates can define shared measures and behavioral groups once, reuse them across report types, and independently refine follow-up questions
- 4 Connected drill-down and reusable analyses let a team pursue follow-up questions
- 3 Configurable reports and shared views, with substantial definition or learning work
- 2 Fixed summaries with little ability to follow a question
- 1 Analysis depends on custom reports built outside the product
Tracking without repeated code changes
How interactions become available for analysis after initial installation. Retrospective means using already collected data; it never recovers interactions that were not captured.
- 5 Interaction capture plus visual or rule-based definitions that apply to past collected events
- 4 Automatic collection of interactions such as clicks and forms
- 3 Automatic collection of basic navigation and lifecycle events
- 2 Application SDK records explicitly instrumented business events
- 1 Import prepared data instead of instrumenting the application
Investigating sessions
How the product connects behavioral problems to what happened in an individual session. Paid capabilities count; included free quotas are separate.
- 5 Connected recordings with developer diagnostics such as console, network or error context
- 4 That investigation workflow on both web and native mobile
- 3 Direct movement from an analysis or experiment into matching recordings
- 2 Visual session playback
- 1 Event timeline without visual playback
Useful ongoing free plan
How far an early team can get without paying in the managed product. These are capacity bands, not a conversion between sessions, users and events. A time-limited trial is not an ongoing free plan.
- 5 At least a million monthly events with core funnels, retention and cohorts, without a small saved-report quota
- 4 At least a million monthly events, with a core report, cohort or saved-report restriction
- 3 Ongoing behavioral analysis for a small audience, such as 500 active users or 10,000 monthly sessions
- 2 Ongoing free basic analytics and replay, with the full analysis workflow gated
- 1 The managed behavioral product starts with a paid plan after its trial
Analysis of customer accounts
How far the unit of analysis can move from a person to a customer organization. Paid add-ons count. A user segment alone does not establish account-level retention.
- 5 Account funnels and account-level retention or broad chart coverage
- 4 Native group or account conversion funnels
- 3 Aggregate events by an organization or another group ID
- 2 User segmentation and profile groups
- 1 Individual activity summaries
Control over deployment
Deployment autonomy in supported commercial offerings. Regional cloud hosting is useful but does not give the customer an operated-on-premise platform. Unsupported community installs do not qualify as supported deployment.
- 5 Supported full application on customer infrastructure, including private or air-gapped deployment
- 4 Supported analysis running against a customer data warehouse
- 3 Dedicated vendor-operated instance with a region choice
- 2 Vendor-operated cloud with a region choice
- 1 Vendor-operated cloud deployment
Testing product changes
How the analytics workflow supports measuring a controlled change. Content-only guide tests are distinguished from assigning arbitrary product features.
- 5 Native feature experiments with advanced statistical methods such as variance reduction or multiple statistical approaches
- 4 Native feature or variable assignment with conversion measurement
- 3 Native randomized tests of guides, tours or similar content
- 2 A documented integration analyzes assignments from a separate experiment platform
- 1 Export or API data can be used to analyze tests elsewhere
Acting through in-app guidance
How directly the platform turns a behavioral segment into an intervention inside the product. Surveys collect feedback; targeted messages and guides can change adoption. External engagement tools are distinguished from native capabilities. Paid add-ons count.
- 5 Native guides or tours tied to behavioral audiences and measured outcomes
- 4 Native multi-step guidance or messaging journeys triggered by behavior
- 3 Native targeted in-app messages or announcements
- 2 Native targeted surveys inside the application
- 1 Send behavioral audiences to a separate engagement or guidance tool
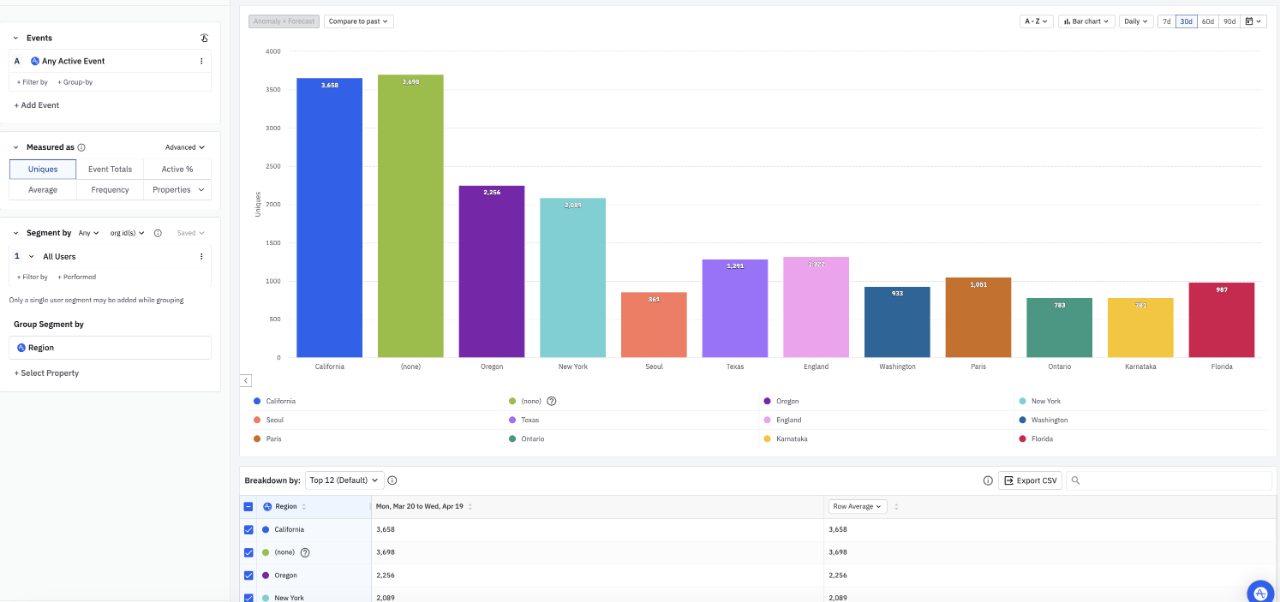
Amplitude suits a product team that wants a shared picture of which customers become active and whether they return. A team can save a metric, such as the proportion of new users who finish setup, and reuse its definition in different reports. That makes comparisons more useful when several people are investigating the same problem.
The free plan includes core analytics and session replay. It also includes feature flags, which let a team show a change to selected users, and A/B tests, which compare versions shown to different users. Its main limitation for a growing team is that saved behavioral cohorts—groups defined by what people did—require the paid Plus plan or above. The Growth plan adds more advanced administration, while analysis of customer companies is a separate add-on on eligible plans.
Compared with PostHog, Amplitude is the more natural choice when product managers and analysts want shared reporting to be the center of their work. PostHog is attractive when the same team also wants to inspect technical problems and run releases from the analytics platform.
Pros
- Reusable metrics across charts, cohorts and tables
- Account funnels can combine actions by different people
- Autocapture, session replay and experiments in one platform
Cons
- Reusable behavioral cohorts are excluded from Free
- Account reporting and advanced governance need eligible paid plans
Who should skip: Teams that need reusable behavioral cohorts while staying entirely on the free plan.
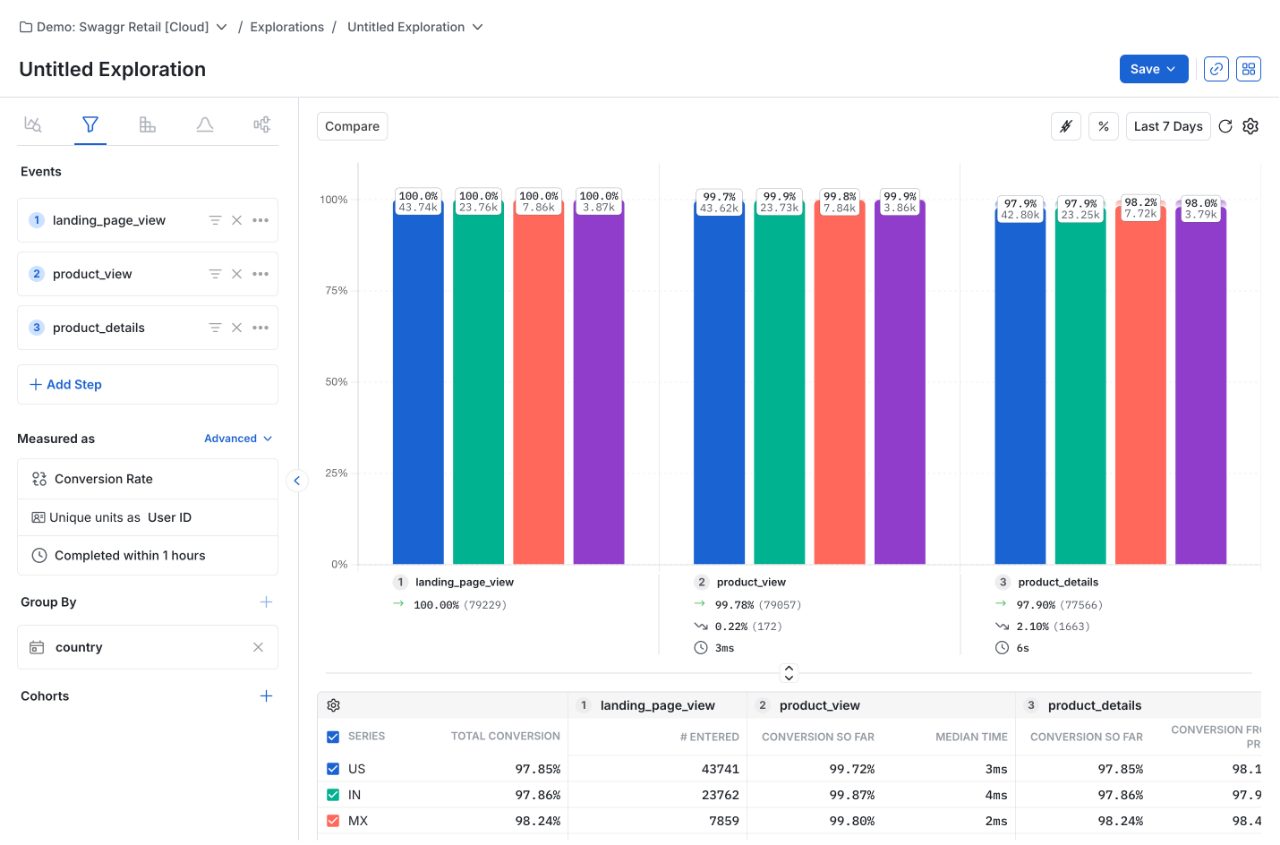
Statsig is a good fit for a team that often tests changes before rolling them out. Its charts can sit beside experiment and feature-flag results on the same dashboard, so the team can see how a change affected the behavior it was trying to improve.
It also includes company-level analysis on every plan. That matters for business software where several employees may use one customer’s account: the team can look at the customer company’s progress as well as each person’s. PostHog charges separately for its group analytics add-on.
The free plan gives a team room to start. The paid Pro plan adds advanced analytics and experimentation. Usage can include experiment exposures—the occasions when a user is assigned to a test—as well as recorded actions, and extra event details can add to the count. Teams that import data late should also know that Statsig Cloud doesn’t automatically recalculate an already computed daily metric when those events arrive.
Pros
- Analytics and live experiment summaries share dashboards
- Group analytics is included without a separate add-on
- Free includes core analysis and a substantial session replay allowance
Cons
- Metered usage can include experiment exposures and extra dimensions
- Cloud daily metrics do not automatically incorporate late data
Who should skip: Teams that rely on routine historical backfills into already computed Cloud metrics.
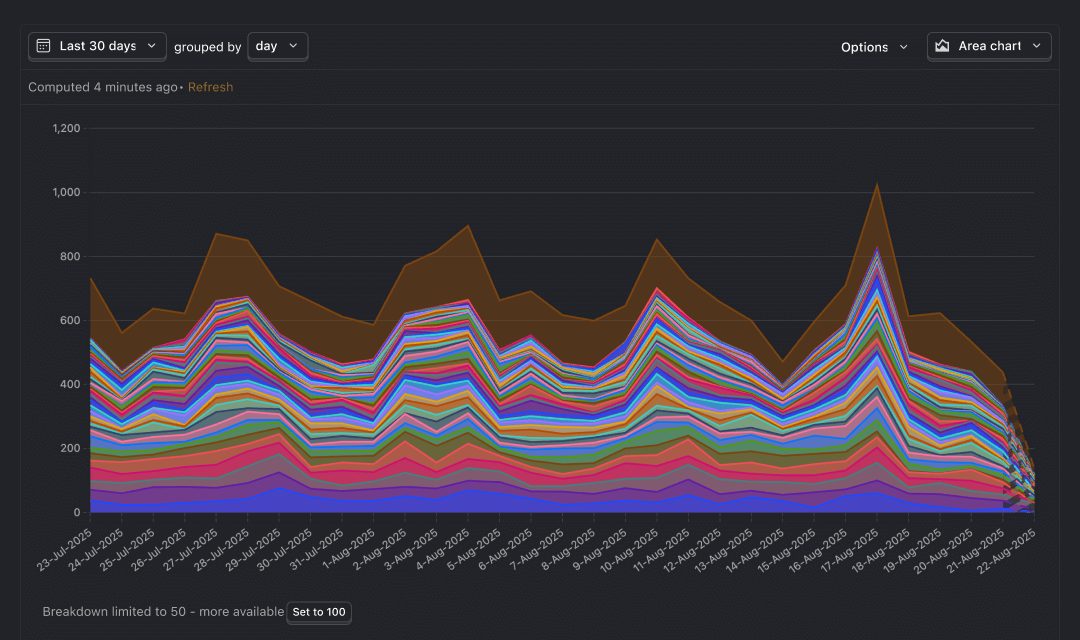
PostHog suits a team whose engineers want to move from understanding a problem to fixing it. A chart can lead to session recordings showing what users did, with console and network details alongside the recording. Feature flags can show a change to some users before everyone gets it; experiments help measure its effect.
That breadth makes PostHog an appealing alternative to Amplitude when engineers will be regular users of the tool. Its free cloud plan covers core analytics, but other features have their own allowances. Company-level analysis is a paid add-on; once enabled, it is billed against all identified events in the project, not just those with a company attached.
PostHog’s code is available for self-hosting, but those installations are officially unsupported. A team that needs vendor support for an installation on its own infrastructure should look at Countly Enterprise instead. Billing limits can prevent extra charges on cloud plans, but events beyond a limit are dropped, leaving gaps in the data.
Pros
- Funnels connect to recordings with developer diagnostics
- Experiments use existing events, funnels and feature flags
- Core analysis fits within an ongoing free cloud allowance
Cons
- Group analytics meters all identified project events once enabled
- Reaching a billing limit can drop events permanently
- Self-hosted deployments have no official support
Who should skip: Buyers who require a supported full application on their own infrastructure.
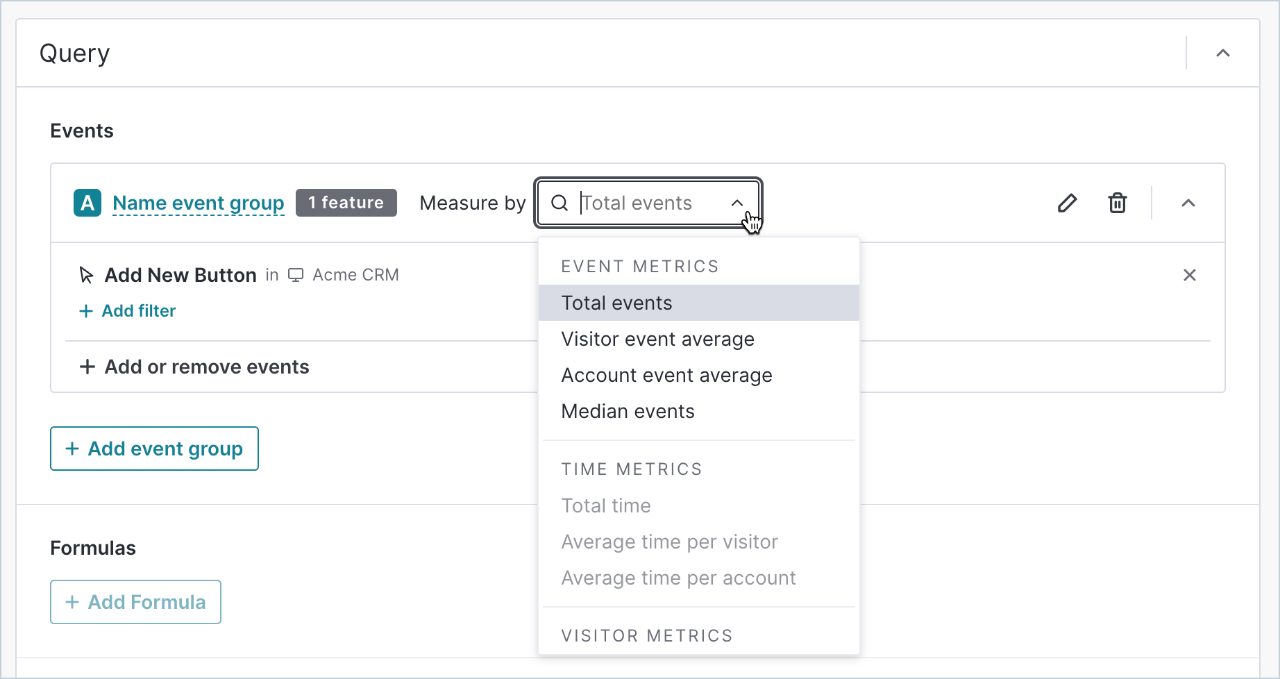
Pendo is the choice to consider when finding an onboarding problem is only half the job. Its analytics show how people use an application, and its in-app guides let a team explain a feature or walk users through a task. That combination is useful when the people responsible for adoption also need to act on what they learn.
Pendo can analyze retention by customer account as well as by individual visitor. Its guide tests compare one guide with another, or with no guide; they are aimed at testing guidance rather than delivering arbitrary product features. Guide tests require Guides Pro.
The free plan is intended for a small audience and excludes Data Explorer and session replay. If the account exceeds the free active-user limit, reports use a sample of 500 visitors. Pendo can use interactions collected since installation even when a page or feature is labeled later, but those labels still need attention as the application changes.
Pros
- Analytics and in-app guides serve the same adoption work
- Retention can measure customer accounts
- Pages and Features can be tagged against collected history
Cons
- Free excludes Data Explorer and session replay
- Page and feature definitions need ongoing maintenance
Who should skip: Teams that primarily need deep self-service analysis and have no use for in-app guides.
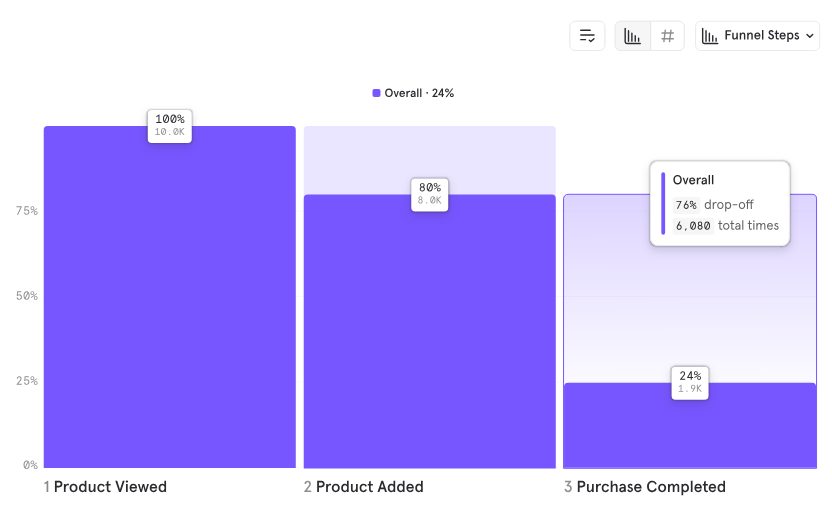
Mixpanel is a strong alternative to Amplitude for product managers who want to explore conversion and retention—whether users return over time. It is also a better fit than Pendo for a team that wants self-service analysis but has little use for in-app guides. Its reports can show where people drop out of a sequence, compare groups of users, and follow the paths they take. Session replay lets a team move from a report to examples of the experience behind it.
The free plan includes the core reports, but its five saved reports per seat may become restrictive for a team that shares many analyses. Analysis by customer company is a paid add-on. Both Mixpanel and Amplitude require a paid plan to save behavioral cohorts—groups of users defined by their actions.
Mixpanel can automatically capture common interactions on web and mobile after its tracking software is installed. That reduces the need to add code for every button, but it can also increase the number of events billed. Mixpanel recommends checking that effect in a test project before relying on automatic capture.
Pros
- Core funnels, retention and flows on every plan
- Formulas and cohorts support more specific questions
- Web and mobile autocapture and session replay
Cons
- Free allows only five saved reports per seat
- Company-level analysis is a paid add-on
Who should skip: Teams that need account-level analytics without paying for an add-on.
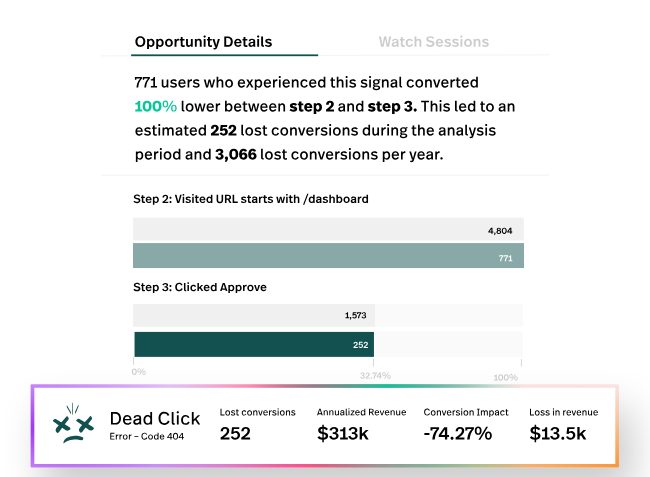
Fullstory is especially useful when a team can see a conversion problem but needs to understand what people experienced. A dashboard metric can lead to session recordings, and developer tools show console messages and network requests alongside them. A designer and an engineer can investigate the same drop-off from different angles.
The free plan includes basic analytics and session replay, but dashboards require a paid plan and retention analysis requires Advanced or Enterprise. Fullstory also offers in-app guides and surveys as an add-on. Pendo is the more direct fit when guiding users is the main reason for buying; Fullstory is compelling when watching and diagnosing sessions comes first.
There is also a choice to make before collecting a long history: Fullstory offers US and EU data centers, but says it cannot transfer an existing account’s data from one to the other.
Pros
- Dashboard metrics open the recordings behind them
- Replay and developer tools support friction investigation
- Tagless capture with retroactive data history
Cons
- Free excludes dashboards; retention needs Advanced or Enterprise
- Collected account data cannot migrate between US and EU centers
Who should skip: Teams expecting the free recording allowance to include the complete behavioral analytics suite.
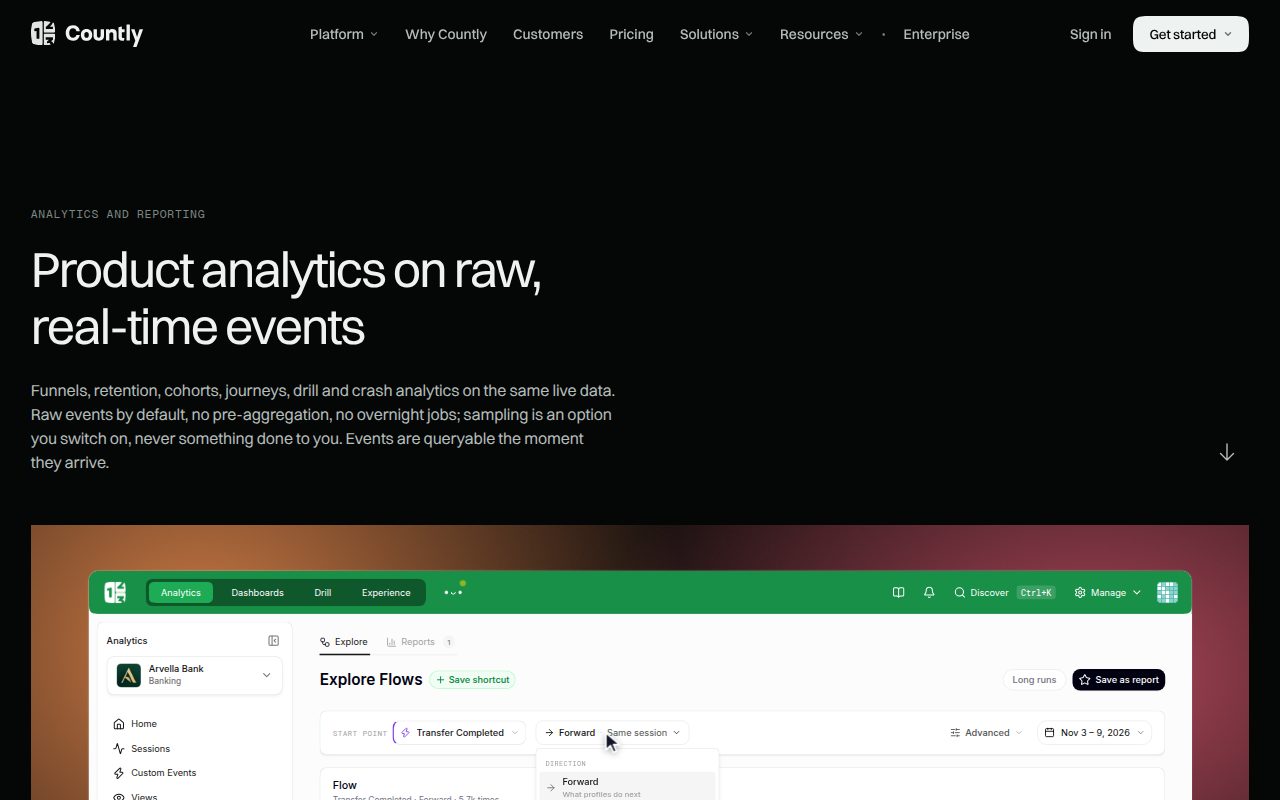
Countly stands out for organizations that need a supported analytics application inside their own infrastructure. Enterprise can run in a customer’s cloud, data center, or air-gapped environment. Flex is a separate managed service: Countly operates a dedicated instance in a selected Google Cloud region.
The tradeoff is cost and setup. Flex’s base plan covers basic analytics, but funnels and retention require the Intelligence add-on. At the entry tier, the base plan and that add-on together start at $219 a month (as of November 2026), before regional or other extras. Enterprise is quoted separately. The product also needs tracking to be added to the application and the resulting data checked.
PostHog is another option for people comfortable running software themselves, but it describes its self-hosted deployment as unsupported. Countly is the clearer choice when a private installation needs an Enterprise contract. OpenPanel also offers paid priority help for self-hosters through Discord. Countly’s separate open-source Lite edition is not the commercial Flex or Enterprise product described here.
Pros
- Enterprise supports customer infrastructure and air-gapped deployment
- Flex provides a dedicated managed instance
- Intelligence combines behavioral reports with live formulas
Cons
- Funnels and retention require an add-on to the Flex base plan
- Private deployment still requires instrumentation and operational planning
Who should skip: Small teams that want a free managed behavioral platform rather than a commercial deployment.
Heap is appealing when a team often realizes too late that it wants to measure a particular interaction. It captures interactions after installation and lets the team define useful events from that history. That can save another development cycle when a new question comes up.
Heap is not alone in that approach: Amplitude, PostHog, Pendo, and Fullstory also support retrospective analysis of collected interactions. The difference worth examining is how comfortably the team can find and define the actions it cares about. Some reviewers find Heap’s concepts and advanced analyses take time to learn.
Free includes six months of history. For teams buying Pro or Premier, session replay is an add-on. Those plans also offer account funnels, which can combine actions by different people at the same customer company.
Pros
- Historical interactions can answer questions defined later
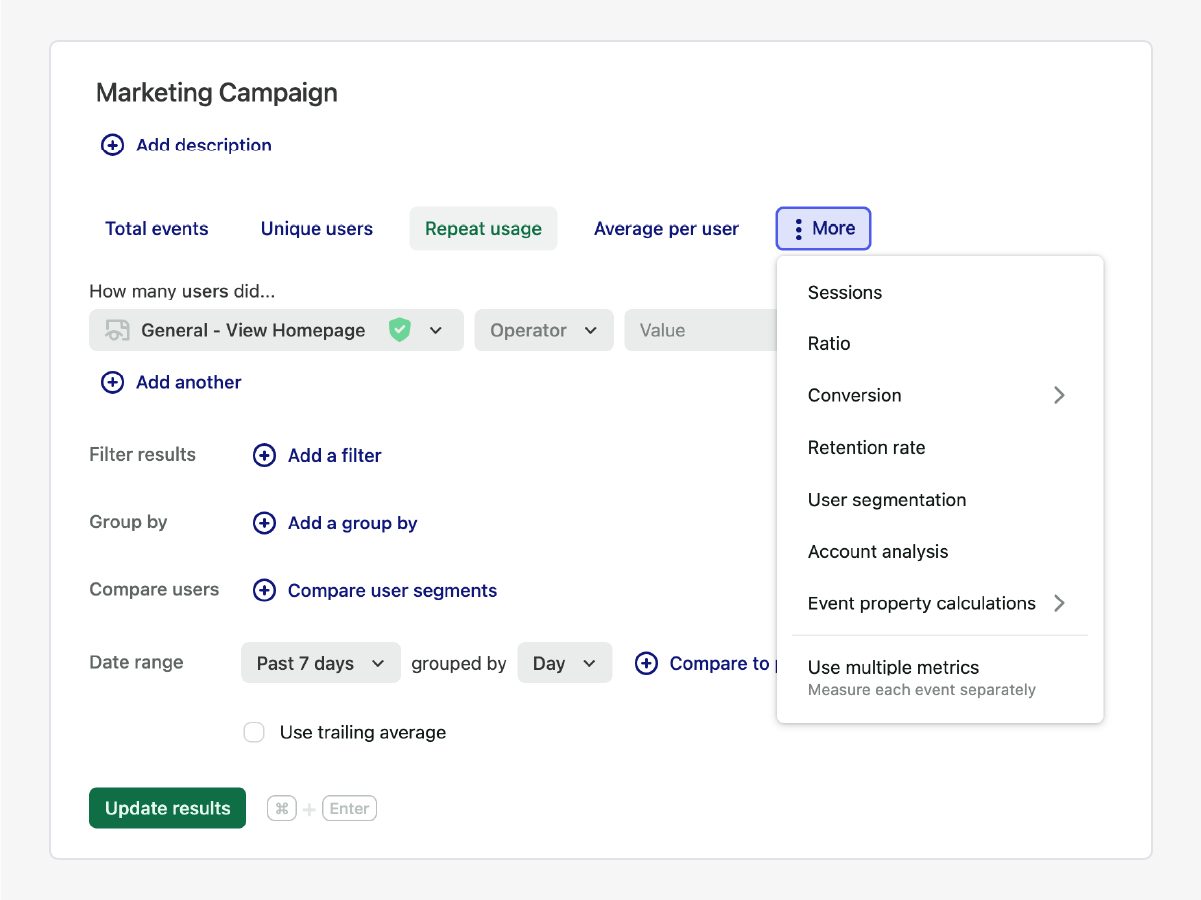
- Funnels, journeys and retention share action-based filters
- Account funnels cover multi-person customer journeys
Cons
- Advanced analysis and event definitions still take learning
- Replay costs extra on Pro and Premier
Who should skip: Teams choosing solely for autocapture without comparing the definition workflow and paid scope.
OpenPanel is worth considering when a small team wants website traffic and product behavior in one place. The same events can feed funnels, return-user reports, and dashboards, while session recordings show what happened during a visit. Cloud is hosted in the EU; the open-source application can also run on your own server.
The tradeoff is what comes with the analytics. OpenPanel’s own comparison says it doesn’t deliver feature flags or run experiments, and it has no equivalent to in-app guides and surveys. A team that wants to measure and release changes from one platform may prefer PostHog; a team that primarily wants the reports may prefer OpenPanel’s narrower scope.
Cloud has a trial rather than a general ongoing free tier. Session replay must be switched on, and recordings are kept for 30 days. Self-hosting is free, with optional paid priority help from the team on Discord; that is a different support arrangement from a negotiated Enterprise contract.

Pros
- Website and product reports use the same event data
- Open-source application can run on your own server
- Session replay is available with the analytics product
Cons
- Cloud has a trial rather than a general free tier
- No built-in feature-flag delivery or experiment engine
- Session recordings are retained for 30 days
Who should skip: Teams that want analytics, feature flags, and experimentation in one platform.
What the bill depends on
The free allowances above are a starting point, not a forecast of what a growing product will cost. The number of events depends on both the number of users and how much each one does. As an example, 10,000 people producing 100 events each create one million events in a month; at 1,000 events each, they create ten million. Session recordings, experiments, customer-company analysis, and longer history may be counted or priced separately.
Automatic capture can reduce the work of naming every button click in advance. It can also increase the volume collected, and it starts when tracking is installed—not before. A click can reveal where someone stopped, but a team may still want an explicit event for an outcome such as a completed signup or successful export.
Where the data and software run can matter just as much as the bill. A dedicated instance operated by a vendor, a tool that queries a customer’s data warehouse, and an application supported on the customer’s own servers give a team different levels of control. Countly Enterprise addresses the last of those needs; PostHog’s self-hosted installation is unsupported.
Also considered
- Google Analytics 4
Useful when understanding traffic and marketing campaigns is a priority. It also has product-analysis features; the tools scored here focus more directly on product-team workflows.
- Adobe Analytics
An enterprise marketing and customer-journey analytics purchase. Consider it when that broader marketing stack is the requirement, rather than choosing a dedicated product analytics platform.
- Hotjar
An experience-research route centered on heatmaps, recordings and feedback, now presented through Contentsquare. Useful for a narrower research task than the behavioral-platform decision here.
- LogRocket
A useful alternative when the priority is session replay, frontend error tracking, and performance debugging. Those engineering needs deserve a separate comparison.
Questions
How does product analytics differ from Google Analytics?
Google Analytics is often used to understand acquisition: how people find a website and which campaigns bring them there. Product analytics focuses on what people do in an app or website afterward. There is overlap, so one tool may answer both sets of questions; some teams use both for different decisions.
Key facts and sources
9 products
Licenses, requirements, starting prices and the evidence behind the scores. Prices as of November 2026.
- License
- Proprietary hosted service
- Runs on
- Web and mobile applications
- Needs
- Amplitude SDK or existing event integration
- Price
- Free plan
- License
- Proprietary service with open-source SDKs
- Runs on
- Web applications
- Needs
- Statsig SDK or an event ingestion integration
- Price
- Free plan
- License
- MIT core; commercial cloud service and paid features, open source
- Runs on
- Web and mobile applications
- Needs
- PostHog tracking SDK and a cloud account
- Price
- Free plan
- License
- Proprietary cloud platform
- Runs on
- Web and mobile applications
- Needs
- Pendo install script or SDK and a business email for Free
- Price
- Free plan
- License
- Proprietary hosted subscription
- Runs on
- Web and mobile applications
- Needs
- Mixpanel SDK and a cloud account
- Price
- Free plan
- License
- Proprietary hosted service
- Runs on
- Web and mobile applications
- Needs
- Fullstory collection installed in the application
- Price
- Free plan
- License
- Commercial Flex and Enterprise licenses; separate open-source Lite edition
- Runs on
- Web and mobile applications
- Needs
- Instrumented application sending validated SDK events
- Price
- From $175.00/month
- License
- Proprietary hosted service
- Runs on
- Web applications
- Needs
- Heap tracking snippet in the application
- Price
- Free plan
- License
- AGPL-3.0, open source
- Runs on
- Web, iOS, Android, and server-side SDKs
- Needs
- A tracking script or SDK
- Price
- Free plan